_BLACKLINE MARKET INTELLIGENCE
Sanford Industrial
Sanford and Seminole County industrial submarket areas
_Market report
Sanford industrial.October 2026.What it means for owners.
A short read for owners of industrial buildings in Sanford. The numbers below come from our October 2026 report.
Download the full report (PDF)_Market snapshot
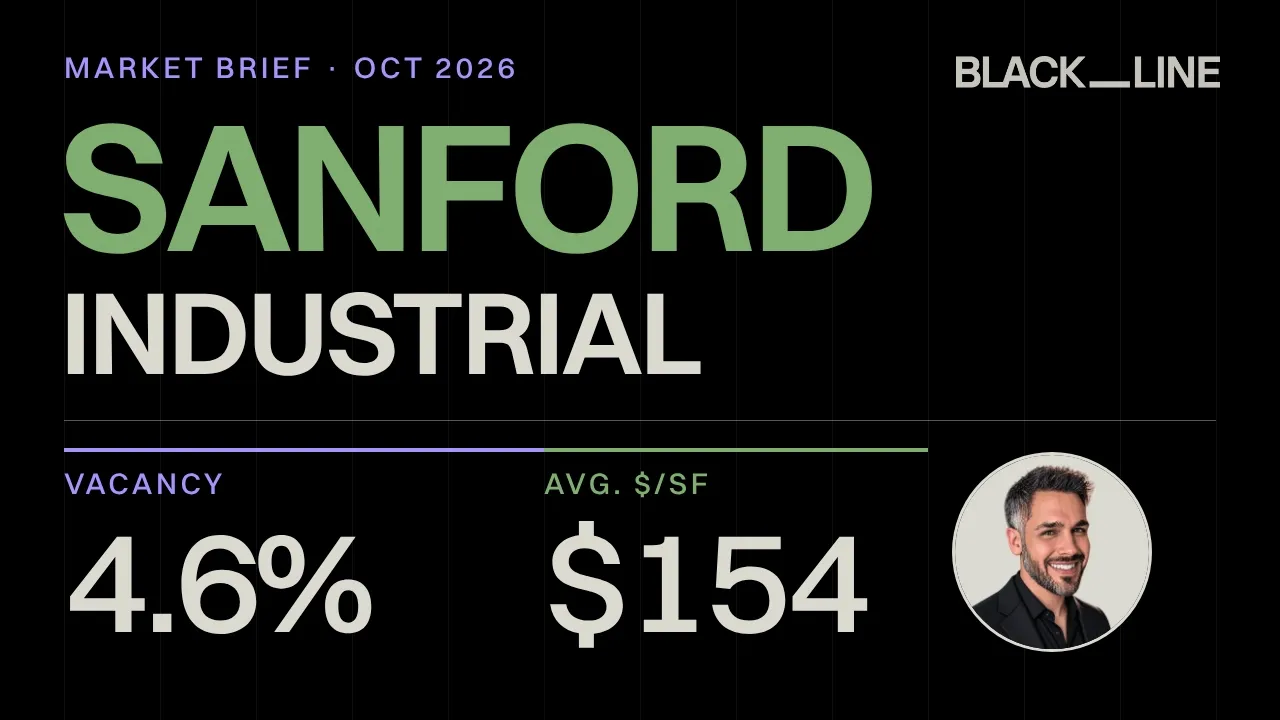
Vacancy is 4.6%, rents average $14.93 per SF NNN and buildings have been selling for $154 per SF on average. The market cap rate is 7.2%.
4.6%
Submarket vacancy
Oct 2026 report
$14.93/SF NNN
Average asking rent
Oct 2026 report
$154/SF
Average sale price
Oct 2026 report
7.2%
Market cap rate
Oct 2026 report
Source: Blackline Research & Market Intelligence

_Featured sale
2901 W. Airport Blvd.
Sanford, FL 32771. Institutional sale, March 2026
$9,750,000$217/SF, excludes land value
- Size
- 44,950 SF
- Price per acre
- $995k/ac
- Cap rate
- 5.85%
- Sale date
- March 2026
Fee-simple sale with a 3-year sale-leaseback. Confidential sale details are available on request.
Source: Blackline Research & Market Intelligence
_Institutional sales
Institutional sales, core assets
Four core sales closed over the last 12 months, from $2,964,900 to $20,410,000. A fifth property was part of a portfolio purchase.
| Property | Sale price | Size (SF) | $/SF | Cap rate | Sale date |
|---|---|---|---|---|---|
| 300 Central Park Dr. | $3,140,000 | 17,000 | $185* | CTD | Aug 2026 |
| 4200 St. Johns Pkwy. | $2,964,900 | 20,000 | $148* | CTD | Apr 2026 |
| 2901 W. Airport Blvd. | $9,750,000 | 44,950 | $217† | 5.85% | Mar 2026 |
| Monroe Commerce Center‡ | $20,410,000 | 116,180 | $176 | 7.0% | Dec 2025 |
| 535 N Elder Rd. | Included in portfolio purchase by EQT | ||||
* Allocated portfolio price.† Excludes land value.CTD = call to discuss.‡ Off-market sale to a 1031 exchange buyer.
_Recent private sales
Private capital sales, private equity and owner-users
Twelve smaller sales closed in the last year. Price per SF ran from $130 to $298, so size, condition and location move the number a lot.
Price per SF by sale
Trailing 12 months (T-12), Oct 2026 report
| Property | Sale price | Size (SF) | $/SF | Cap rate | Sale date |
|---|---|---|---|---|---|
| 5508 Benchmark Ln. | $2,000,000 | 10,898 | $184 | N/A | Sep 2026 |
| 34 Keyes Ct. | $1,700,000 | 6,175 | $275 | 6.0% PF | Jul 2026 |
| 750 Wylly Ave. | $1,700,000 | 9,314 | $183 | 8.0% | Jul 2026 |
| 400 Central Park Dr. | $4,500,000 | 25,056 | $180 | N/A | May 2026 |
| 801 Cornwall Rd. | $1,500,000 | 11,000 | $136 | N/A | Feb 2026 |
| 104 Challenger Ct. | $3,348,000 | 17,000 | $197 | N/A | Feb 2026 |
| 110 Tech Dr. | $6,200,000 | 40,000 | $155 | N/A | Dec 2025 |
| 1101 Central Park Dr. | $1,450,000 | 6,250 | $232 | 3.4% | Dec 2025 |
| 1201 Upsala Rd. | $4,275,000 | 18,360 | $233 | N/A | Dec 2025 |
| 130 Tech Dr. | $2,850,000 | 16,190 | $176 | N/A | Dec 2025 |
| 1501 W. 1st St. | $2,000,000 | 15,425 | $130 | N/A | Nov 2025 |
| 1140 Albright Rd. | $3,575,000 | 12,000 | $298 | N/A | Oct 2025 |
PF = pro forma.N/A = not available.
_Who owns and who buys
Private owners hold most of the asset value. Private buyers took most of the sales volume, and institutions were second at 32%.
Who owns
Share of asset value, Oct 2026 report
- Private55%
- User25%
- Institutional17%
- Private equity2%
- REIT/Public1%
Private owners hold 55% of industrial asset value in Sanford. Private landlords have tended to price rents below market because they focus on occupancy and relationships, not yield. Before your next lease renewal, compare your rent with what is trading today.
Who is buying
Share of sales volume, Oct 2026 report
- Private61%
- Institutional32%
- User7%
Institutional buyers now account for 32% of Sanford's industrial sales volume, second only to private buyers at 61%. Their interest is strongest for large industrial-zoned parcels.
Source: Blackline Research & Market Intelligence
_What this means for you
Institutions are buying.Know your rent.Know your value.
- If you plan to hold, compare your current rent to the $14.93 per SF NNN average asking rent before your next renewal.
- If you are thinking about selling, institutional buyers took 32% of Sanford's industrial sales volume. Their interest is strongest for large industrial-zoned parcels.
- If you want a recent comparable, 2901 W. Airport Blvd. sold for $9,750,000 in March 2026 at a 5.85% cap rate, as a fee-simple sale with a 3-year sale-leaseback.
- Whatever you decide, start with a number built for your building, not an average.
_Questions owners ask
Questionsowners ask.
What is the industrial vacancy rate in Sanford?
Industrial vacancy in the Sanford submarket is 4.6%, according to the October 2026 Blackline report.
What do industrial buildings rent for in Sanford?
The average asking rent is $14.93 per SF on a NNN basis, as of the October 2026 Blackline report. Your building may lease above or below that depending on size, clear height, condition and location.
What are industrial buildings selling for per SF in Sanford?
The average sale price is $154 per SF in the October 2026 report. Private capital sales over the trailing 12 months ranged from $130 to $298 per SF.
What is the industrial cap rate in Sanford?
The market cap rate is 7.2% in the October 2026 report. The featured sale at 2901 W. Airport Blvd. traded at a 5.85% cap rate in March 2026.
Who is buying industrial property in Sanford?
Private buyers made up 61% of industrial sales volume, institutional buyers 32% and owner-users 7%, per the October 2026 report.
Who owns industrial property in Sanford?
By asset value, private owners hold 55%, owner-users 25%, institutions 17%, private equity 2% and REIT and public owners 1%, per the October 2026 report.
How do I find out what my Sanford industrial building is worth?
Request a broker opinion of value from Thevin Campton, CCIM at blacklinecre.com/valuation or call 407.780.7123. You get it in 1 to 2 days.
_Talk to Thevin
Know your numberbefore you decide.
Get a broker opinion of value for your building in 1 to 2 days. It shows what an investor and an owner-user would likely pay, so you can decide to hold or sell with clear numbers in front of you.
Request your valuation
Thevin Campton, CCIM
Founder & Principal Broker, Blackline CRE
407.780.7123255 South Orange Ave., Suite 104 #1861
Orlando, FL 32801